QUICK SUMMARY
FFMI tells you how much lean mass you carry for your height, but it does not show on its own what you look like. Body fat changes everything. At 1.80 m, an FFMI of 22 can mean 79 kg at 10% body fat or 89 kg at 20%. This guide shows the weights behind each level.
Why Two People With the Same FFMI Can Look Different
Any set of FFMI physique examples has to start with one fact. FFMI is fat free mass divided by height squared, and it ignores fat on purpose. That is useful for measuring muscle development, but it means the number alone cannot tell you how someone looks in a mirror.
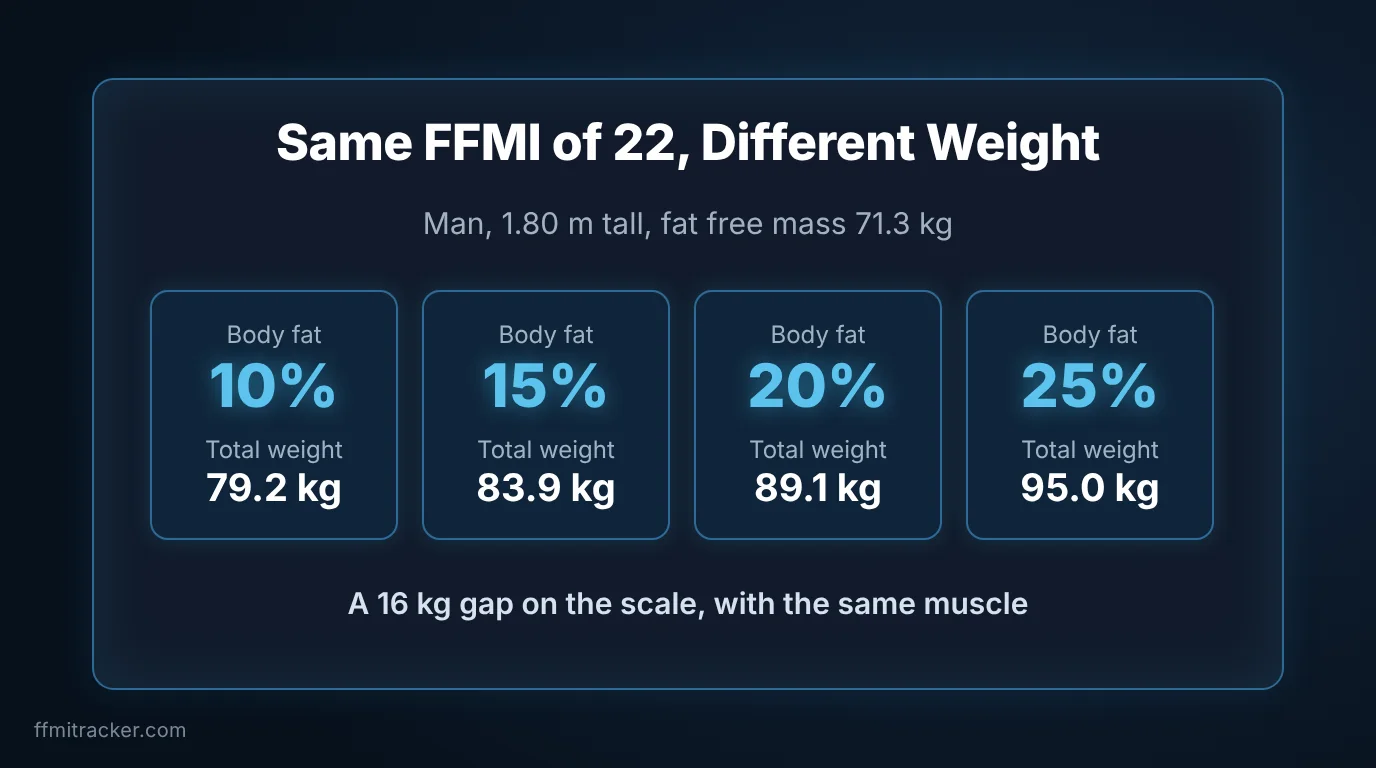
Take a man who is 1.80 m tall with an FFMI of 22. His fat free mass is 71.3 kg. What he weighs, and how he looks, depends on the fat added on top of that:
Body fat | Total body weight | What you would see |
|---|---|---|
10% | 79.2 kg (175 lb) | Visible abs, clear muscle separation |
15% | 83.9 kg (185 lb) | Muscular, with a smooth waist |
20% | 89.1 kg (196 lb) | Strong and solid, abs hidden |
25% | 95.0 kg (209 lb) | Big, with a clearly soft midsection |
Same FFMI, a 16 kg difference on the scale. The visual column is a general description, not a measured result, and it varies with where each person stores fat. If you want the full explanation of how the number is built, our guide on what FFMI is and how it is calculated covers it step by step.
FFMI Physique Examples by Level
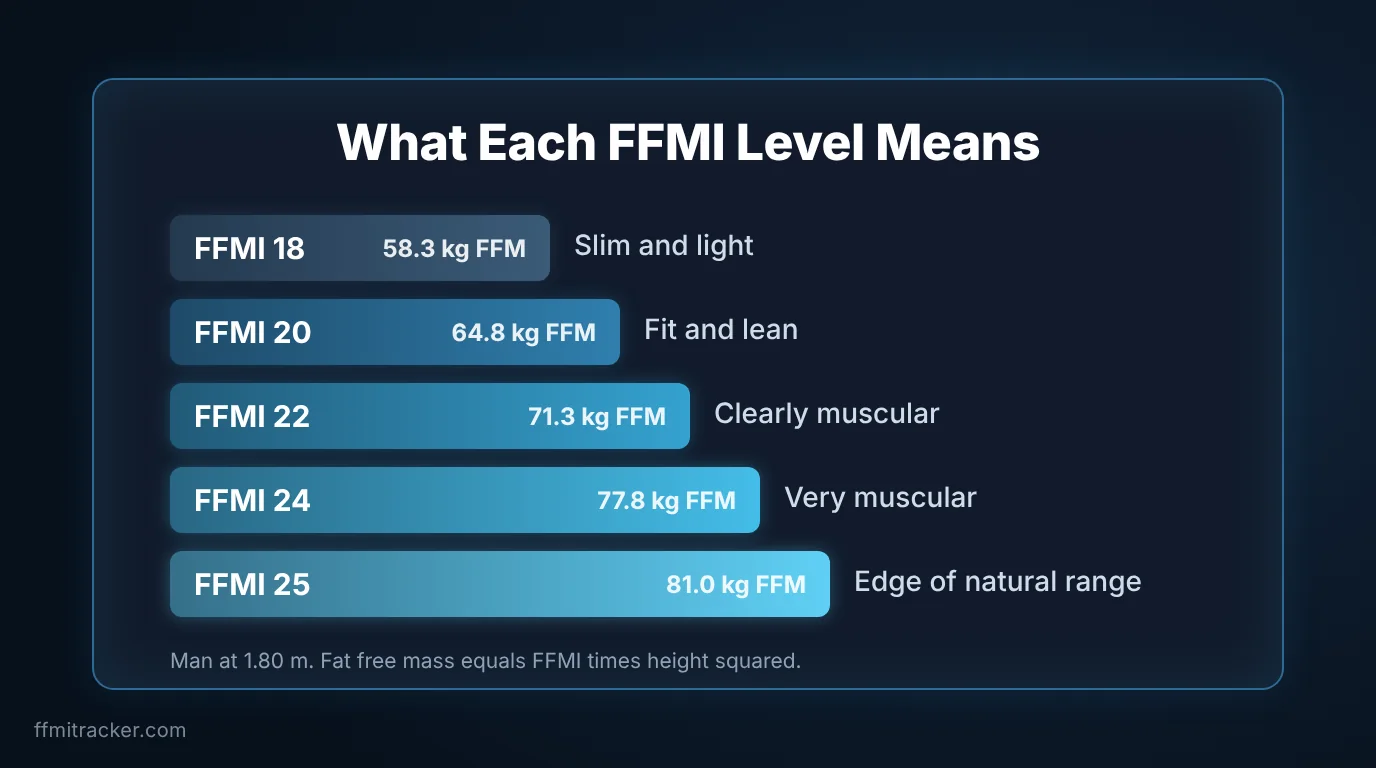
The profiles below use a man who is 1.80 m tall, because at that height the normalized FFMI equals the raw FFMI and nothing needs adjusting. Weights come from our own calculation: fat free mass equals FFMI times height squared, then divided by one minus body fat. They are not measurements of real people.
FFMI | Fat free mass | Weight at 10% fat | Weight at 15% fat | Weight at 20% fat |
|---|---|---|---|---|
18 | 58.3 kg | 64.8 kg | 68.6 kg | 72.9 kg |
20 | 64.8 kg | 72.0 kg | 76.2 kg | 81.0 kg |
22 | 71.3 kg | 79.2 kg | 83.9 kg | 89.1 kg |
24 | 77.8 kg | 86.4 kg | 91.5 kg | 97.2 kg |
25 | 81.0 kg | 90.0 kg | 95.3 kg | 101.2 kg |
FFMI 18: slim and light
A slim build with little visible muscle. Clothes hang straight from the shoulders and the chest and arms look flat. In the Swiss adult sample that gave us the reference values, the median FFMI for men aged 18 to 34 was 18.9, so an 18 sits just under average.
FFMI 20: fit and lean
You look like someone who trains. Shoulders and arms show shape in a t shirt, and with body fat around 12% to 15% there is real definition. At 1.80 m this is about 72 to 76 kg of total weight.
FFMI 22: clearly muscular
This is where people stop asking whether you lift. Broad shoulders, thick arms and a developed chest show even under a loose shirt. It takes years of consistent training, which we describe in our guide on what is a good FFMI score.
FFMI 24: very muscular
Dense, wide and heavy for your height. At 1.80 m you carry about 78 kg of fat free mass, and weigh 86 to 97 kg depending on how lean you are. Very few people reach it without a long training history and favorable genetics.
FFMI 25 and above: the edge of the natural range
At 1.80 m this means 81 kg of fat free mass. Whether a number above 25 is possible without drugs is a separate debate. The next section covers what the data shows.
What Real Athlete Data Shows
Two published studies give real numbers to compare against.
Kouri and colleagues (1995) measured 157 male athletes: 83 who used anabolic steroids and 74 who did not. The normalized FFMI of those who had not used steroids reached a limit of about 25.0. A group of 20 Mr. America winners from the era before steroids (1939 to 1959) had a mean normalized FFMI of 25.4. Many steroid users in the sample went above 25, and some above 30. The authors called their findings preliminary.
Fields and colleagues (2024) measured 111 NCAA Division III football players using bioelectrical impedance. The mean FFMI was 23.5 (standard deviation 2.04), and individual values ranged from 18.1 to 27.7. Linemen averaged 24.8 and specialty players averaged 20.6. The authors concluded that an athlete’s upper limit may exceed 25. Their study did not test for drug use, and bioimpedance has its own error, so treat the top of that range with caution.
What this tells you: 22 to 25 is the zone of serious, long term training. Anything above 25 is rare. It shows up in genetic outliers, and sometimes in drug users. We cover the natural limit in more depth in our guide to FFMI ranges.
The Same FFMI at Different Heights
Taller men need more total weight for the same FFMI, because height is squared. This table shows the weight at 12% body fat for three common targets:
Height | FFMI 20 | FFMI 22 | FFMI 25 |
|---|---|---|---|
1.65 m (5 ft 5) | 61.9 kg | 68.1 kg | 77.3 kg |
1.70 m (5 ft 7) | 65.7 kg | 72.2 kg | 82.1 kg |
1.75 m (5 ft 9) | 69.6 kg | 76.6 kg | 87.0 kg |
1.80 m (5 ft 11) | 73.6 kg | 81.0 kg | 92.0 kg |
1.85 m (6 ft 1) | 77.8 kg | 85.6 kg | 97.2 kg |
1.90 m (6 ft 3) | 82.0 kg | 90.2 kg | 102.6 kg |
1.95 m (6 ft 5) | 86.4 kg | 95.1 kg | 108.0 kg |
These use raw FFMI. Kouri’s normalized version adds 6.3 × (1.80 − height in meters), so shorter men gain a little and taller men lose a little. A man at 1.65 m with a raw FFMI of 24.1 has a normalized FFMI of about 25.
Why Online FFMI Claims Are Often Wrong
When you see someone claim a number in a photo or a forum post, three things usually distort it.
- Body fat is a guess. Take a man who is 1.80 m and 80 kg. At 12% body fat his FFMI is 21.7. At 17% it is 20.5. A five point error in body fat moves him more than a full FFMI point.
- Height is rounded. Because height is squared, a 2 cm error changes the result noticeably.
- Raw and normalized get mixed up. Many posts quote one and compare it to the other.
If you want to check your own number properly, use the same method every time. Our FFMI calculator takes height, weight and body fat and shows both raw and normalized values. For how FFMI compares with a simpler measure, see FFMI vs BMI.
What About Women?
Everything above is for men. Women have lower FFMI ranges at every level, so the same targets do not apply. Our guide to FFMI for women has score ranges and examples built for them.
Frequently Asked Questions
These are the questions people ask most often about this topic, with a short answer first.
What is considered a good FFMI score?
For men, 20 to 22 is a good, fit range, 22 to 25 is excellent and usually takes years of training, and above 25 is rare. The Swiss reference median for young men is 18.9. Women have lower ranges, so check the women’s guide for your own scale.
How rare is a 21 FFMI?
A 21 is clearly above the reference median of 18.9 for young men, but not rare among people who train. We did not find a published percentile for exactly 21 that we could verify, so we do not quote one. Compare yourself against athletes, not the general public.
Is a 26 FFMI possible naturally?
It is very uncommon. Kouri’s 1995 data put the limit for non steroid users near 25, and Mr. America winners from before steroids averaged 25.4. A 2024 football study saw values up to 27.7, but did not test for drug use, so it cannot prove they were natural.
What was Arnold's FFMI?
No measured figure exists. Online estimates of 28 to 29 come from his stage weight and guessed body fat, so they are rough. He has publicly said he used steroids during his competing years, which is the context any such number needs.
Can the same FFMI look different on two men?
Yes. FFMI ignores fat, so two men at an FFMI of 22 can weigh 79 kg and 95 kg at 1.80 m, depending on body fat. Frame size, muscle shape and where fat is stored also change how the same number looks.
How do I find my own FFMI level?
You need height, weight and body fat percentage. Fat free mass is weight minus fat, and FFMI is that number divided by height squared. Our calculator does the sum and shows normalized FFMI too, which is useful if you are not 1.80 m tall.
The Bottom Line
FFMI measures lean mass, not appearance. Use the weight tables above to see what a level means at your height and body fat, and keep your body fat method the same each time. If you want to move up a level, our guide on how to increase FFMI covers the training and nutrition side.
This article is for education and is not medical advice. Talk to a doctor or registered dietitian before changing your diet or training because of a body composition result.
References and Sources
- Kouri EM, Pope HG Jr, Katz DL, Oliva P. Fat free mass index in users and nonusers of anabolic androgenic steroids. Clinical Journal of Sport Medicine. 1995;5(4):223-228. PMID 7496846. Source
- Fields JB, Jones MT, Kuhlman NM, Magee MK, Feit A, Jagim AR. Fat free mass index in a large sample of collegiate American football athletes. International Journal of Exercise Science. 2024;17:129. Source
- Schutz Y, Kyle UUG, Pichard C. Fat free mass index and fat mass index percentiles in Caucasians aged 18 to 98 years. International Journal of Obesity. 2002;26(7):953-960. PMID 12080449. Source