QUICK SUMMARY
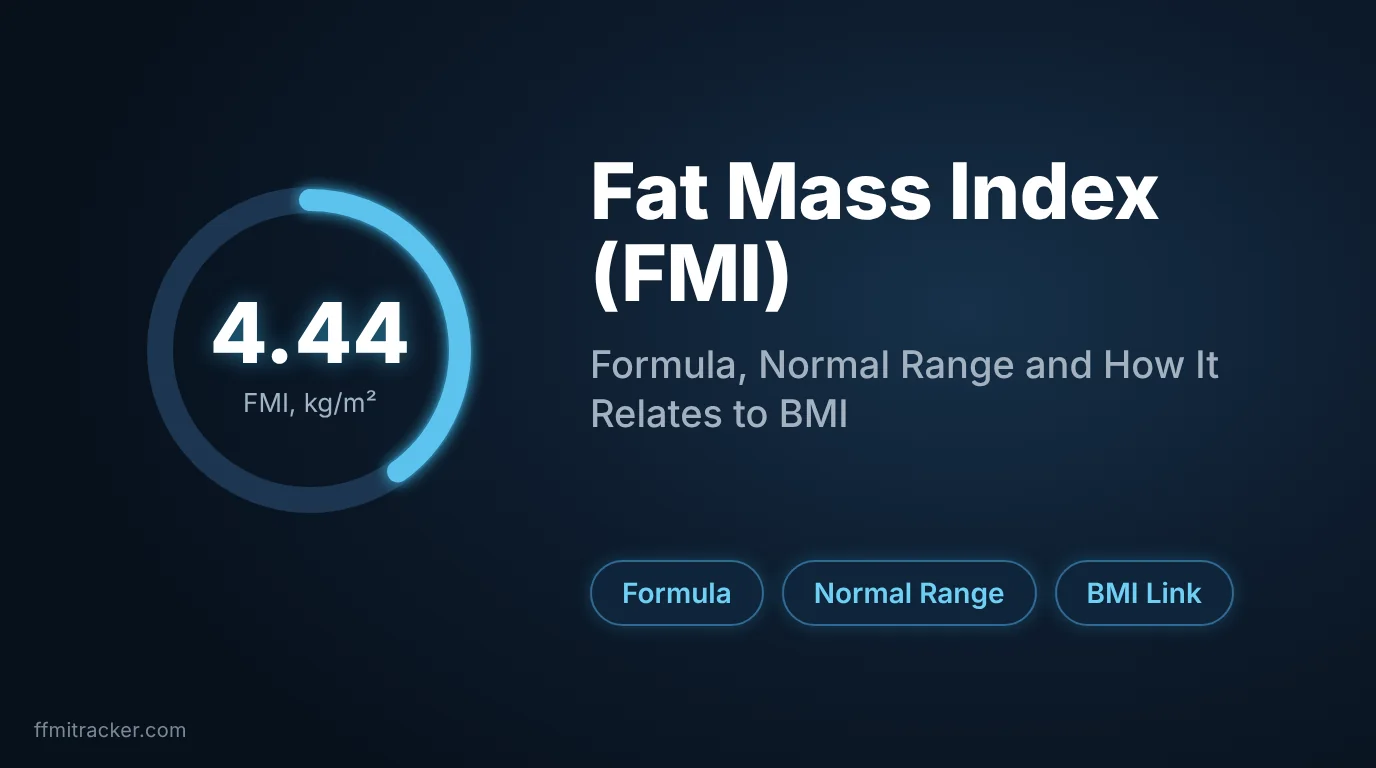
Fat mass index (FMI) is your fat mass in kilograms divided by your height in meters squared. It shows how much fat you carry for your height. In one large US study, a normal FMI was 3 to 6 for men and 5 to 9 for women. FMI plus fat free mass index equals BMI.
What Is Fat Mass Index?
Fat mass index, or FMI, measures how much body fat you have relative to your height. It is built the same way as BMI, but it uses only your fat mass instead of your whole body weight.
The idea comes from a 1990 paper by VanItallie and colleagues in the American Journal of Clinical Nutrition. They pointed out that expressing fat or lean mass as a percentage of body weight, or as raw kilograms, misleads people of different heights. A tall person naturally carries more of everything. Dividing by height squared fixes that, and they proposed two matching indices: one for fat free mass and one for fat mass.
FMI answers a question body fat percentage cannot. Percentage tells you what share of your weight is fat. FMI tells you how much fat you carry for your frame.
How to Calculate Fat Mass Index
You need three numbers: weight in kilograms, height in meters and body fat percentage.
Fat mass = body weight × (body fat % ÷ 100)
FMI = fat mass ÷ height squared
Two worked examples:
Man | Woman | |
|---|---|---|
Weight | 80 kg | 62 kg |
Height | 1.80 m | 1.65 m |
Body fat | 18% | 25% |
Fat mass | 14.4 kg | 15.5 kg |
Height squared | 3.24 | 2.72 |
FMI | 4.4 kg/m² | 5.7 kg/m² |
Both people fall inside the normal range in the next section. The sum is easy. The weak point is the body fat percentage you start with, because every home method has error. A 5 point error on an 80 kg man shifts his fat mass by 4 kg and his FMI by more than 1 point at this height.
Normal Fat Mass Index Range
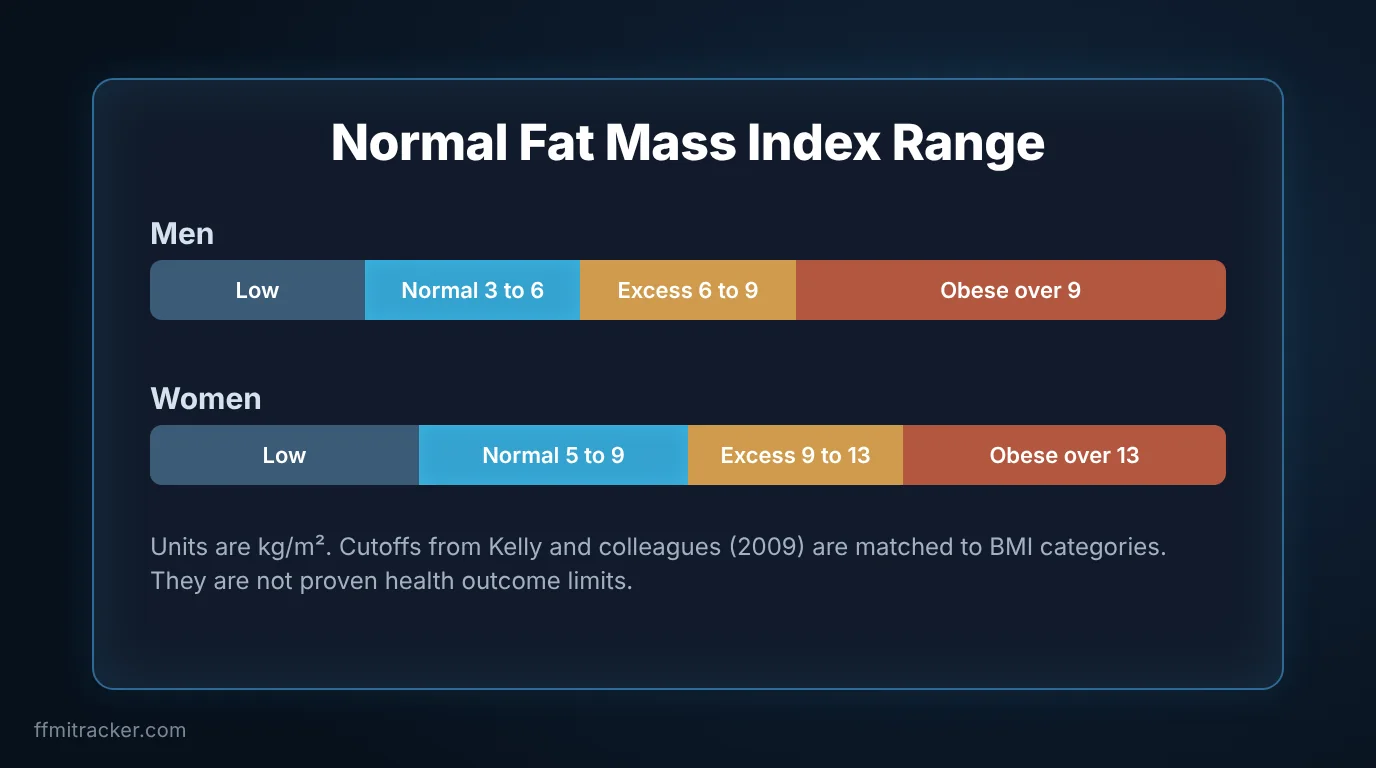
The most useful published ranges come from Kelly, Wilson and Heymsfield (2009). They used DEXA scans from the US NHANES survey, with data for people aged 8 to 85, and built FMI categories by matching how common each BMI category was in the sample.
Category | Men (kg/m²) | Women (kg/m²) |
|---|---|---|
Severe fat deficit | under 2 | under 3.5 |
Moderate fat deficit | 2 to under 2.3 | 3.5 to under 4 |
Mild fat deficit | 2.3 to under 3 | 4 to under 5 |
Normal | 3 to 6 | 5 to 9 |
Excess fat | over 6 to 9 | over 9 to 13 |
Obese class I | over 9 to 12 | over 13 to 17 |
Obese class II | over 12 to 15 | over 17 to 21 |
Obese class III | over 15 | over 21 |
An important caveat: these cutoffs were matched to how common BMI categories are in the population. They were not set from health outcomes, so treat them as a statistical guide and not as a diagnosis.
A second reference point is the Swiss study by Schutz, Kyle and Pichard (2002) of 5,635 adults. For adults aged 18 to 34, the median FMI was 4.0 for men and 5.5 for women. Women sit higher than men at this age.
FMI vs Body Fat Percentage
They measure related things in different ways.
Body fat percentage | Fat mass index | |
|---|---|---|
Formula | fat mass ÷ body weight | fat mass ÷ height squared |
Unit | % | kg/m² |
Compares people of different heights | Poorly | Well |
Changes when you gain muscle | Yes, it falls | No, only fat counts |
Easy to understand | Very | Needs a chart |
The second to last row is the useful one. If you add 5 kg of muscle and keep the same fat, your body fat percentage drops, but your FMI does not move. FMI follows fat only.
Fat Mass Index, FFMI and BMI Together
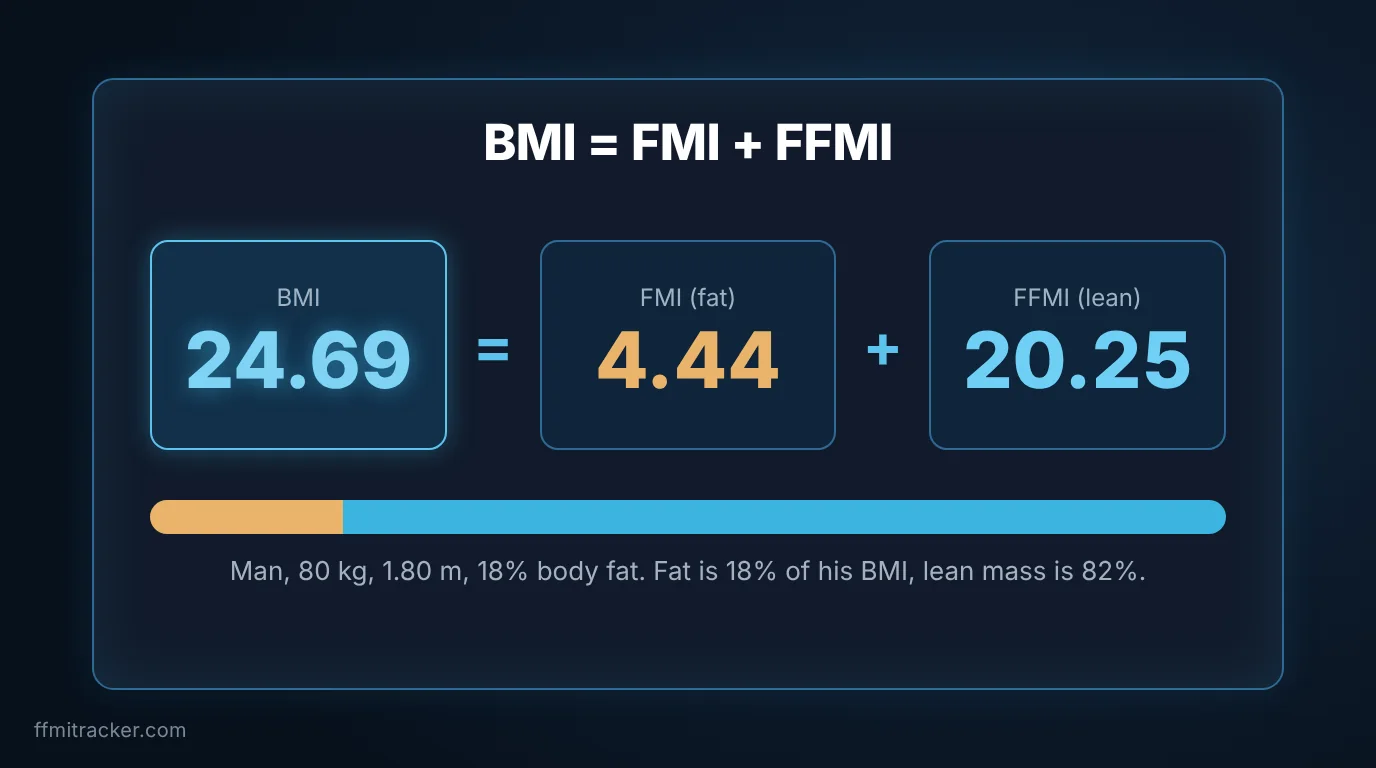
BMI is your weight divided by height squared. Your weight is fat mass plus fat free mass. Dividing both by height squared gives a simple identity:
BMI = FMI + FFMI
Using the man above: FMI 4.4 plus FFMI 20.2 gives a BMI of 24.7. For the woman: FMI 5.7 plus FFMI 17.1 gives 22.8.
This is why BMI alone can mislead. Take a man who is 1.80 m and 81 kg. His BMI is 25.0 either way, but look at what is inside:
Body fat | FMI | FFMI | Category by FMI |
|---|---|---|---|
12% | 3.0 | 22.0 | Normal, low end |
28% | 7.0 | 18.0 | Excess fat |
Same BMI, very different bodies. FMI shows the difference that BMI hides. Our guide on FFMI vs BMI explains the muscle side of this, and what FFMI is and how it is calculated covers the other half of the identity.
How Fat Mass Changes With Age
In a study of 2,735 men and 2,490 women aged 15 to 98 (Kyle and colleagues, 2001), fat mass and body fat percentage rose steadily with age, while fat free mass peaked in midlife and then fell. So a stable scale weight in later life often hides more fat and less muscle. FMI helps you notice this, because your fat mass can climb even when your weight stays flat.
When Is FMI Useful?
- You want a fairer measure than BMI or body fat percentage, especially if you train.
- You are tall or short, and percentages feel unreliable for your height.
- You are cutting, and want to confirm that the weight you lose is fat, not muscle.
- You use DEXA, which reports fat mass, lean mass and often both indices.
FMI has limits. It depends entirely on the body fat figure you give it, and different methods disagree by several points. Use the same method each time, and read changes over months, not days. For your lean side, our FFMI calculator works out fat free mass and FFMI from the same three inputs.
Frequently Asked Questions
These are the questions people ask most often about this topic, with a short answer first.
What should your fat mass index be?
For adults in the large US DEXA reference, a normal FMI is 3 to 6 kg/m² for men and 5 to 9 kg/m² for women. Values above those ranges are classed as excess fat. The ranges are statistical guides, not health cutoffs.
How do you calculate fat mass index?
Multiply your weight by your body fat percentage to get fat mass in kilograms, then divide by your height in meters squared. An 80 kg man at 1.80 m with 18% body fat has 14.4 kg of fat mass and an FMI of 4.4 kg/m².
What should my fat mass be for my age?
There is no single target. Average fat mass rises steadily across adult life, while fat free mass peaks in midlife and declines. Use the sex specific normal FMI range as your guide, and watch the direction of change on the same measuring method.
What is the difference between FMI and body fat percentage?
Body fat percentage is fat as a share of body weight. FMI is fat mass divided by height squared, in kg/m². FMI compares people of different heights better, and it does not shift when you gain muscle, while percentage falls. Use both for a fuller picture.
Is FMI better than BMI?
For judging fat, yes. BMI cannot tell fat from muscle, so two people with the same BMI can have very different FMI. Because BMI equals FMI plus FFMI, using both indices shows what your weight is actually made of, fat or lean tissue.
Does a low fat mass index mean I am healthy?
Not always. In the US reference, an FMI below 3 for men or below 5 for women is classed as a fat deficit. Very low fat has its own health problems, so lower is not automatically better. Talk to a doctor if your number is far below normal.
The Bottom Line
Fat mass index is your fat mass divided by height squared. A normal range in one large US study is 3 to 6 for men and 5 to 9 for women. Pair it with FFMI and you can see exactly what your BMI is made of. Measure the same way each time, and judge trends over months.
This article is for education and is not medical advice. Talk to a doctor or registered dietitian before changing your diet or training because of a body composition result.
References and Sources
- VanItallie TB, Yang MU, Heymsfield SB, Funk RC, Boileau RA. Height normalized indices of the body’s fat free mass and fat mass: potentially useful indicators of nutritional status. American Journal of Clinical Nutrition. 1990;52(6):953-959. PMID 2239792. Source
- Kelly TL, Wilson KE, Heymsfield SB. Dual energy X ray absorptiometry body composition reference values from NHANES. PLoS ONE. 2009;4(9):e7038. PMID 19753111. Source
- Schutz Y, Kyle UUG, Pichard C. Fat free mass index and fat mass index percentiles in Caucasians aged 18 to 98 years. International Journal of Obesity. 2002;26(7):953-960. PMID 12080449. Source
- Kyle UG, Genton L, Slosman DO, Pichard C. Fat free and fat mass percentiles in 5225 healthy subjects aged 15 to 98 years. Nutrition. 2001;17(7-8):534-541. PMID 11448570. Source
- Measurement Toolkit. Fat free mass (FFM) and fat mass (FM) normalized for size. Source