QUICK SUMMARY
Fat free mass (FFM) is everything in your body that is not fat: muscle, bone, organs, blood, skin and the water inside them. Calculate it as body weight minus fat mass. A typical young man at 1.75 m carries about 58 kg of it, and a typical young woman at 1.65 m about 42 kg.
What Is Fat Free Mass?
Fat free mass is your total body weight minus the fat in your body. What is left is skeletal muscle, bone, organs, blood, connective tissue, skin and the water held in all of them. Researchers shorten it to FFM, and body composition scales and DEXA reports use the same label.
The water part is bigger than most people expect. Most body composition methods assume that about 73% of fat free mass is water (a ratio of 0.732 in the classic two component model). So a hydration swing can change an FFM reading on a scale while your muscle has not changed at all. We come back to that in the measurement section.
One thing to get straight early: fat free mass is not a muscle measurement. Muscle is one part of it. MRI studies suggest skeletal muscle makes up roughly 45% to 50% of it. A person with a high FFM may have a lot of muscle, a large frame, or simply more water on board that morning.
Fat Free Mass vs Lean Body Mass vs Muscle Mass
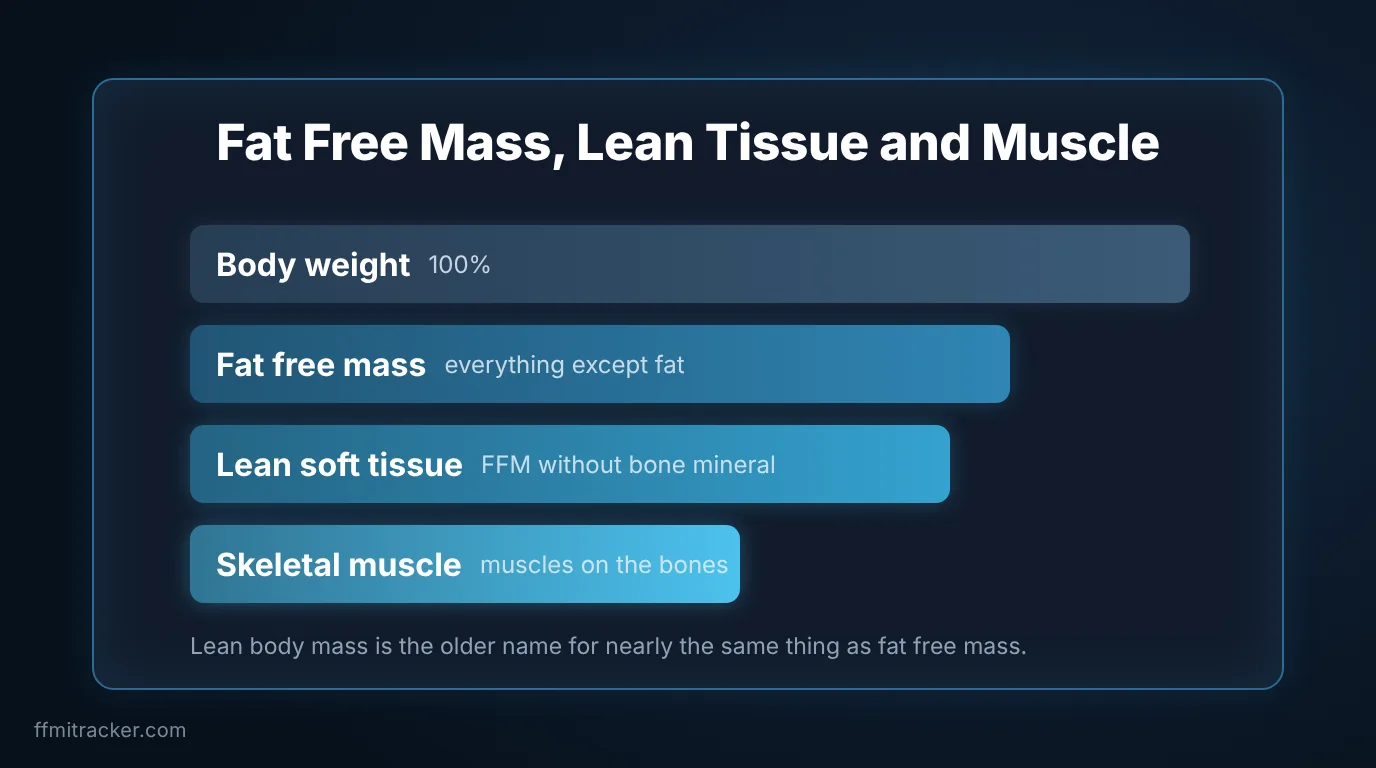
These terms get swapped constantly. They overlap, but they are not identical on every report.
Term | What it covers | Where you will see it |
|---|---|---|
Fat free mass (FFM) | Everything except fat: muscle, bone, organs, water, skin | BIA scales, DEXA reports, research papers |
Lean body mass (LBM) | The older name for nearly the same thing | Online calculators, medical dosing |
Lean soft tissue | FFM without bone mineral | DEXA reports |
Skeletal muscle mass | Only the muscles attached to bones | MRI scans, some BIA devices |
The lean body mass debate is older than most gym science. Albert Behnke introduced the term in 1942 and said it included a small amount of structural fat from cell membranes, which he called essential fat. Fat free mass, in his view, had none. A 2024 review in Advances in Nutrition by Heymsfield and colleagues went back through the original studies and reached a different conclusion: the two are chemically the same, and the authors recommend using the term FFM.
In practice, treat a calculator’s “lean body mass” and a scale’s “fat free mass” as the same number. The one to watch is the “lean mass” line on a DEXA report. Depending on the report, it may leave out bone mineral, so check which one you are reading before you compare.
How to Calculate Fat Free Mass
The formula when you know your body fat percentage
This is the simplest and, if your body fat number is good, the most accurate home method.
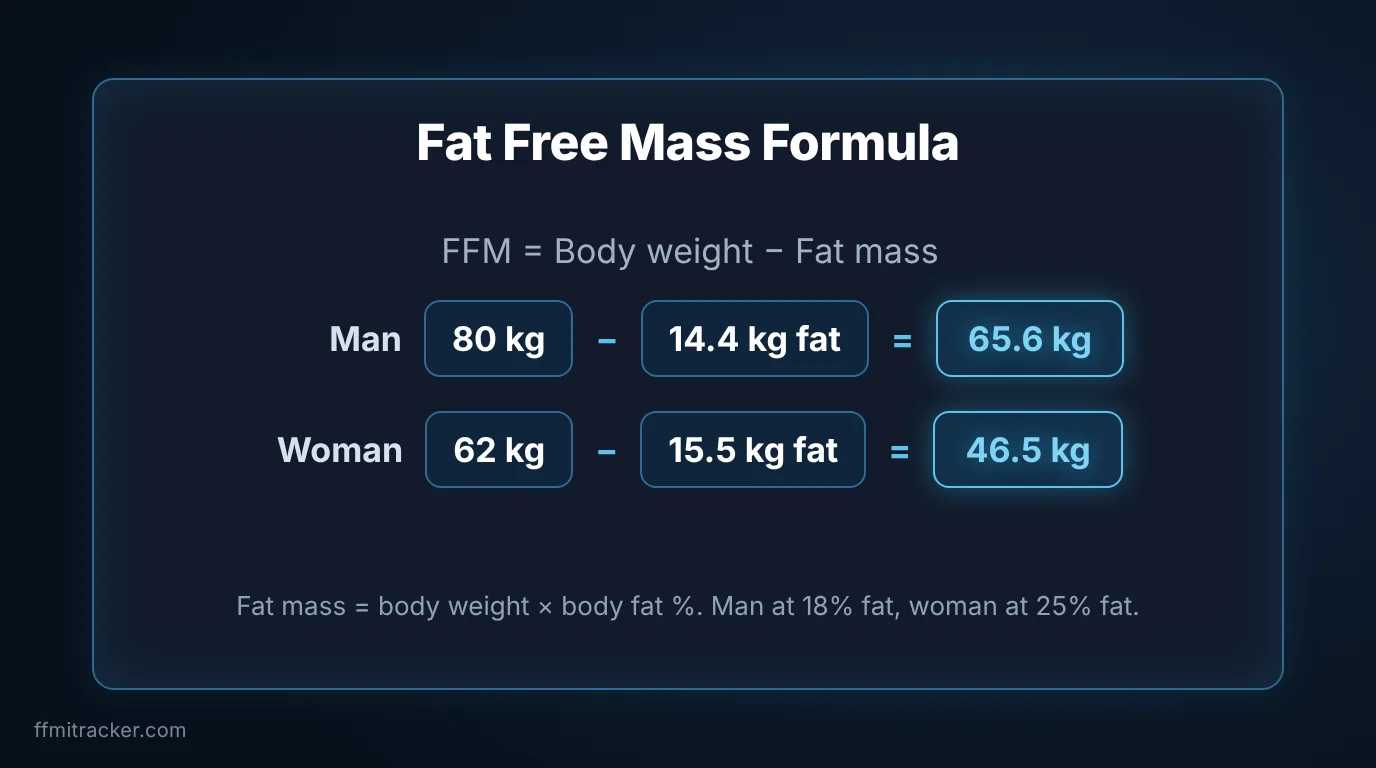
Fat mass = body weight × (body fat % ÷ 100)
Fat free mass = body weight − fat mass
Two worked examples:
Man | Woman | |
|---|---|---|
Body weight | 80 kg | 62 kg |
Body fat | 18% | 25% |
Fat mass | 14.4 kg | 15.5 kg |
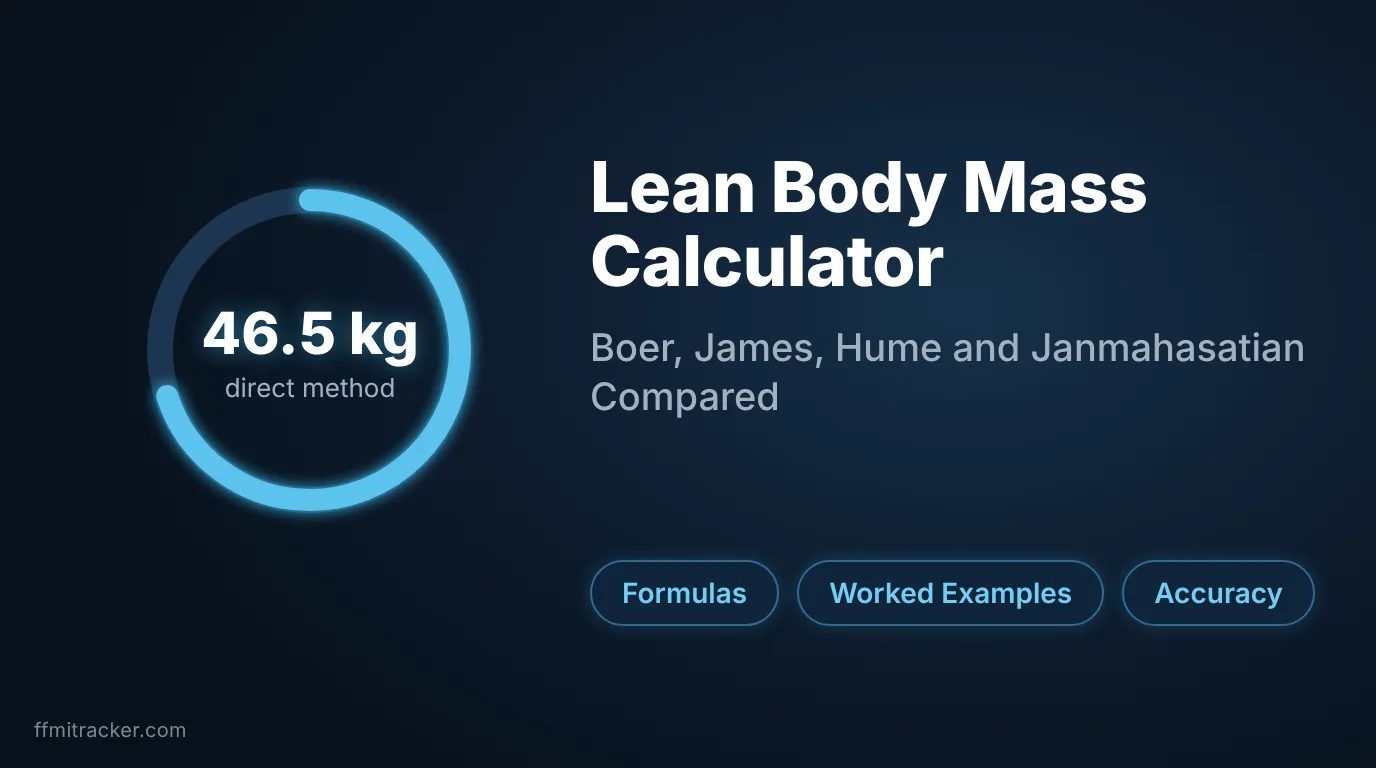
Fat free mass | 65.6 kg (about 145 lb) | 46.5 kg (about 102 lb) |
The result is only as good as the body fat number you put in. A 5 point error on an 80 kg man shifts his fat free mass by 4 kg. That is the main weakness of any home calculation.
If you would rather skip the arithmetic, our fat free mass calculator gives your FFM in kg or lbs, along with your FFMI and normalized FFMI, in a few seconds. Any FFM calculator needs the same three inputs: weight, height and body fat percentage.
Estimating it without a body fat number
When all you have is height and weight, regression formulas can estimate lean body mass. The two most used are Boer and Hume. Weight (W) is in kilograms, height (H) in centimeters.
Formula | Men | Women |
|---|---|---|
Boer | 0.407 × W + 0.267 × H − 19.2 | 0.252 × W + 0.473 × H − 48.3 |
Hume | 0.3281 × W + 0.33929 × H − 29.5336 | 0.29569 × W + 0.41813 × H − 43.2933 |
Here is how they compare with the body fat method for the same two people (the man is 180 cm, the woman 165 cm):
Body fat method | Boer | Hume | |
|---|---|---|---|
Man, 80 kg, 18% | 65.6 kg | 61.4 kg | 57.8 kg |
Woman, 62 kg, 25% | 46.5 kg | 45.4 kg | 44.0 kg |
Both formulas land lower than the body fat method, and the gap is large for the man. That makes sense. The formulas assume an average body for your height and weight. They cannot see that he carries more muscle than average. Use them as a rough sanity check, never as your tracking number.
Normal Fat Free Mass Range in kg (Men and Women)
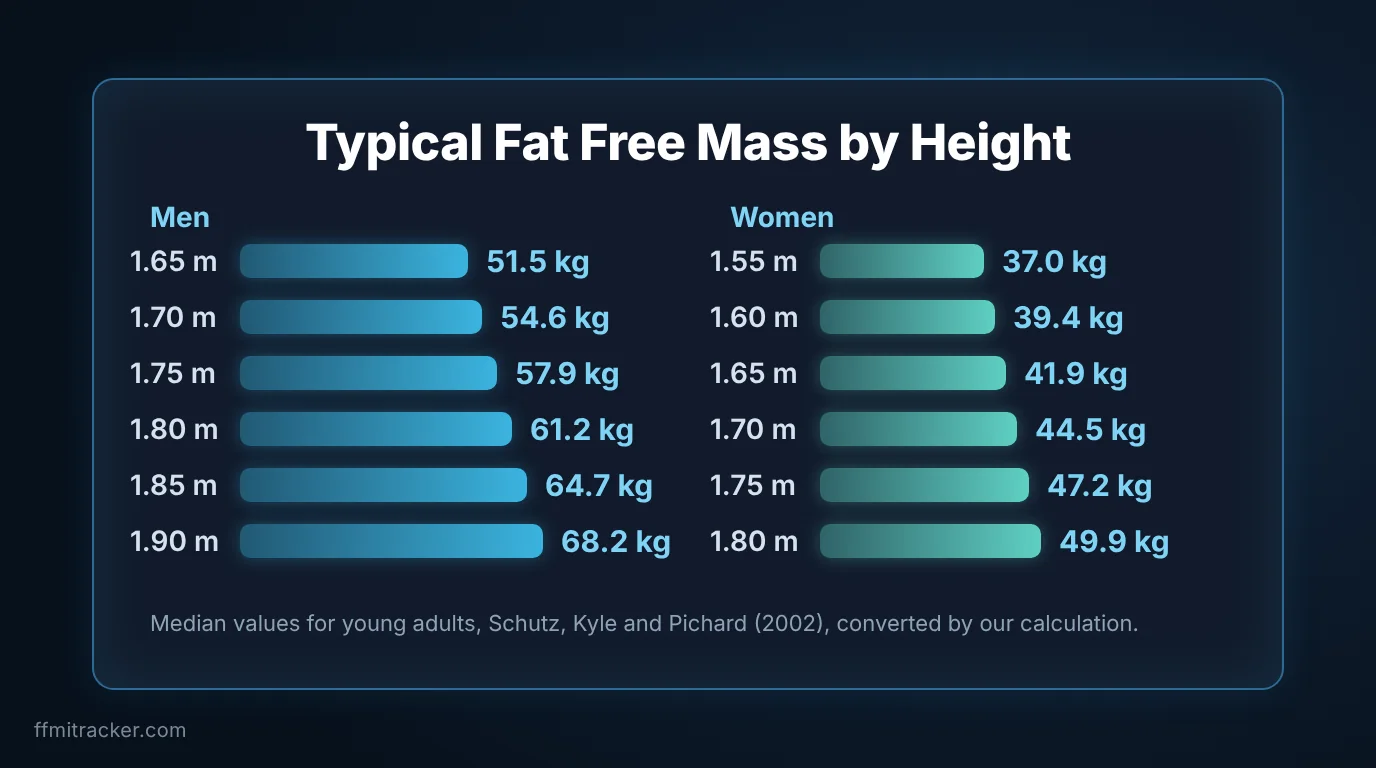
There is no single official normal range for fat free mass, because it scales with height. What exists are large population studies, and the most useful one for adults is by Schutz, Kyle and Pichard (2002). It measured 5,635 Swiss adults (2,986 men and 2,649 women) with bioimpedance and reported the median fat free mass index, which is FFM divided by height squared. For adults aged 18 to 34 the medians were 18.9 for men and 15.4 for women.
Multiply the index back by height squared and you get kilograms. Here is that calculation for common heights:
Height | Men, typical FFM | Height | Women, typical FFM |
|---|---|---|---|
1.65 m (5 ft 5) | 51.5 kg (113 lb) | 1.55 m (5 ft 1) | 37.0 kg (82 lb) |
1.70 m (5 ft 7) | 54.6 kg (120 lb) | 1.60 m (5 ft 3) | 39.4 kg (87 lb) |
1.75 m (5 ft 9) | 57.9 kg (128 lb) | 1.65 m (5 ft 5) | 41.9 kg (92 lb) |
1.80 m (5 ft 11) | 61.2 kg (135 lb) | 1.70 m (5 ft 7) | 44.5 kg (98 lb) |
1.85 m (6 ft 1) | 64.7 kg (143 lb) | 1.75 m (5 ft 9) | 47.2 kg (104 lb) |
1.90 m (6 ft 3) | 68.2 kg (150 lb) | 1.80 m (5 ft 11) | 49.9 kg (110 lb) |
A fair warning about this table. These are our own estimates, calculated as the published median multiplied by height squared. They describe young adults in one Swiss sample, not a medical cutoff, and they will not fit everyone. Regular lifters and athletes sit well above them. The numbers show where an average person lands, nothing more.
The same study gives a useful shortcut for the percentage. The median fat mass index was 4.0 for young men and 5.5 for young women. Because FFMI plus fat mass index equals BMI, fat free mass works out to roughly 82% of body weight in young men and 74% in young women.
How Fat Free Mass Changes With Age
Fat free mass does not stay put. In a study of 2,735 men and 2,490 women aged 15 to 98 (Kyle and colleagues, 2001), average FFM peaked in men aged 35 to 44 and in women aged 45 to 54, then declined.
- Men over 85 had 8.9 kg (14.8%) less than men aged 35 to 44.
- Women over 85 had 6.2 kg (14.3%) less than women aged 45 to 54.
Working backward from those percentages, the peak averages come to roughly 60 kg for men and 43 kg for women. Fat mass and body fat percentage rose steadily across the same ages, so the extra weight many older adults carry is fat, not muscle. The practical point is that a flat number on the scale can hide a falling FFM. For women, our guide on FFMI for women shows how scores shift by decade and what is realistic.
How Is Fat Free Mass Measured?
Every method estimates FFM. None counts it directly in a living person, and each one rests on an assumption.
Method | How it works | The catch |
|---|---|---|
DEXA scan | X rays split the body into bone, fat and lean tissue | Assumes a fixed hydration level in lean tissue |
BIA (scales, handheld, clinic) | Sends a small current through the body to estimate body water | Sensitive to hydration, recent meals and exercise |
Underwater weighing, air displacement | Measures body density | Assumes a fixed density for fat free mass (1.100 g/cc) |
Skinfold calipers | Estimates fat from skin thickness at set sites | Depends heavily on who is pinching |
Four compartment model | Combines weight, density, body water and bone mineral | Research use only |
Our advice, which is a practical view and not a study result: pick one method and stick to it. Measure in the morning, before eating, with similar hydration each time. A bathroom scale reading and a DEXA reading will disagree, and neither is wrong. If you compare across devices, you will chase noise.
Can You Increase Fat Free Mass?
Yes, mostly through resistance training and enough protein. The best evidence on protein is a 2018 meta analysis of 49 trials with 1,863 people (Morton and colleagues). Protein supplementation on top of training added about 0.3 kg of FFM on average. Gains stopped rising once total intake passed roughly 1.6 g per kg of body weight per day. The benefit shrank with age and was larger in people who already trained.
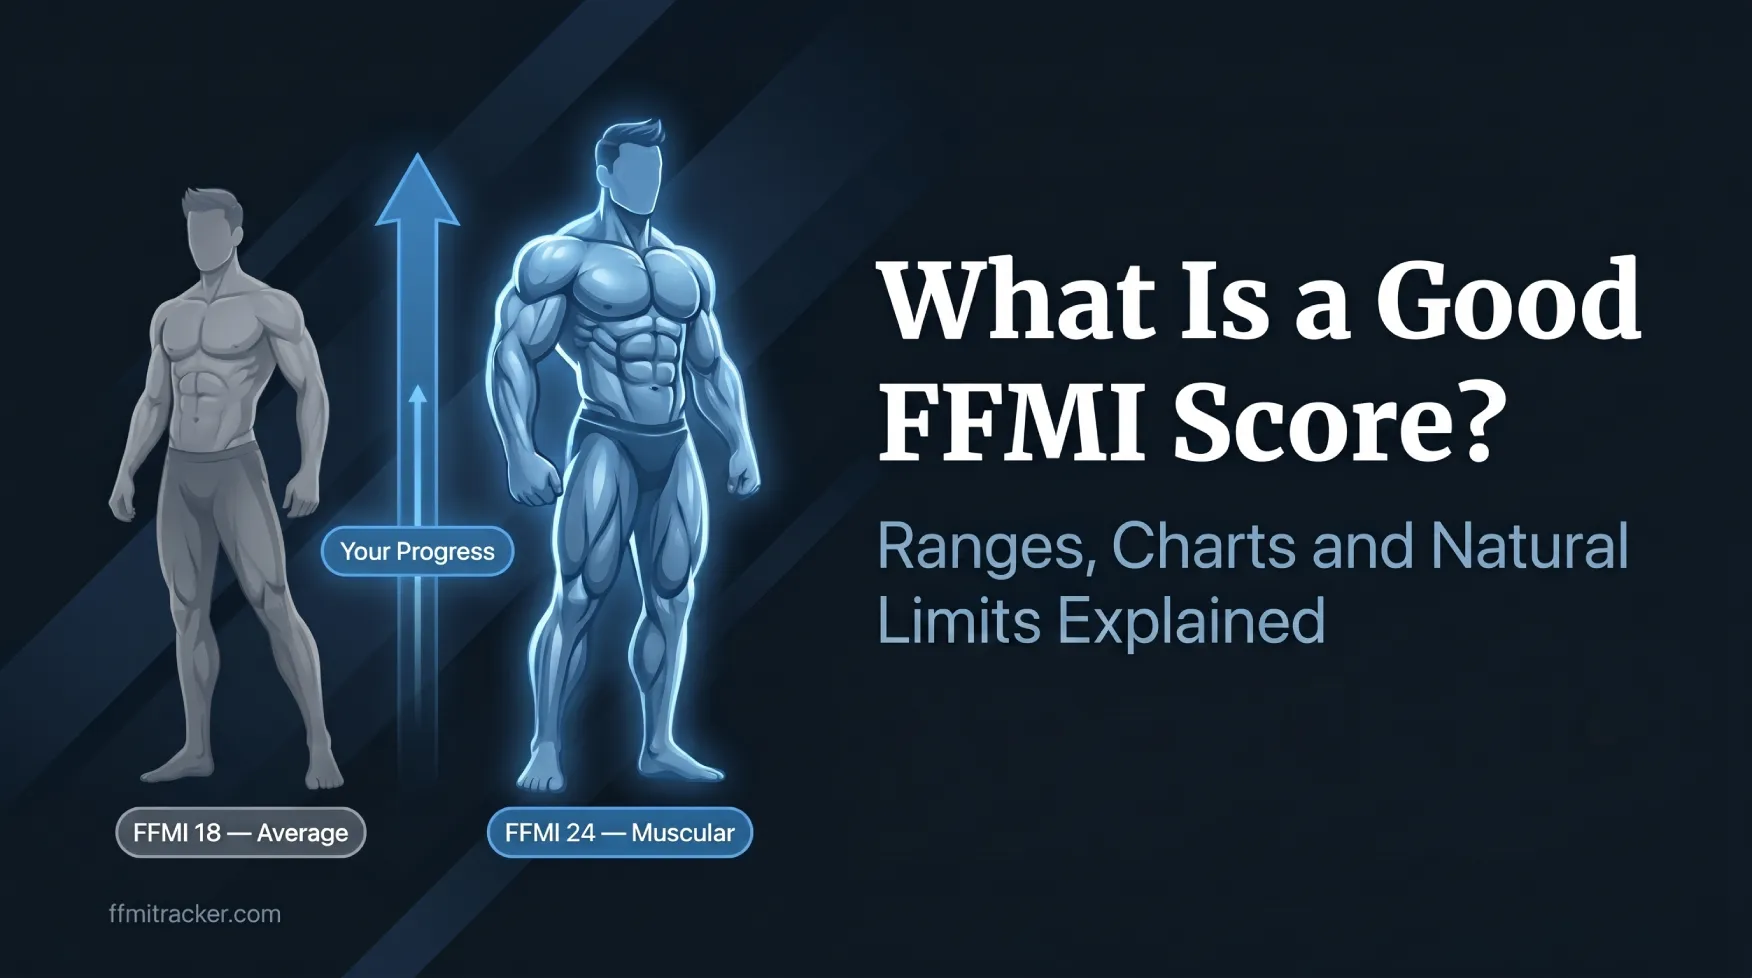
Read that plainly: protein helps, and training does the work. For what realistic progress looks like at different training levels, see our guide to what is a good FFMI score.
Fat Free Mass vs FFMI: Which Number Do You Need?
Fat free mass is a weight in kg. FFMI divides it by height squared, which lets you compare people of different heights. If you only want to know how much you carry, FFM is enough. If you want to know whether that is a lot for your height, you need FFMI. Our guide on what FFMI is and how it is calculated covers that step.
Frequently Asked Questions
These are the questions people ask most often about this topic, with a short answer first.
What is a good fat free mass?
A good fat free mass depends on your height and sex. In a large Swiss study of young adults, the typical man at 1.75 m carried about 58 kg and the typical woman at 1.65 m about 42 kg. Lifters and athletes sit above that, and values fall after about age 55.
The height table above lets you find your own row.
What does "free fat mass" mean?
People often flip the words, but the correct term is fat free mass, or FFM. It is the part of your body weight that is not fat, which covers muscle, bone, organs, connective tissue, skin and body water. Scales and DEXA reports usually print it as FFM.
What is the difference between fat mass and fat free mass?
Fat mass is the weight of all the fat in your body. Fat free mass is everything else: muscle, bone, organs, skin and water. The two always add up to your total body weight, so if you know one and your weight, you can work out the other.
How do I work out my fat free mass?
Multiply your body weight by your body fat percentage to get fat mass, then subtract that from your body weight. An 80 kg man at 18% body fat has 14.4 kg of fat mass, so his fat free mass is 65.6 kg. Our calculator does the same sum for you.
How do I calculate fat free mass without knowing my body fat?
Use the Boer or Hume formulas, which estimate lean body mass from height and weight. For a man, Boer is 0.407 × weight in kg + 0.267 × height in cm − 19.2. Treat the answer as a rough estimate, because the formula cannot see your actual muscle or fat.
How can I improve my fat free mass?
Lift weights consistently and eat enough protein. A meta analysis of 49 trials found protein added only about 0.3 kg of fat free mass on top of training, and benefits levelled off near 1.6 g per kg of body weight per day. Training does the heavy lifting.
Should fat free mass go up or down?
For most adults, the goal is to keep it steady or raise it. Average fat free mass peaks in midlife and then falls, with people over 85 carrying roughly 14% less than at their peak. Losing it faster than that, especially during dieting, usually means lost muscle.
Why is my fat free mass going up?
Most often it is resistance training, eating more, or both. On a BIA scale it can also be water, because the device estimates fat free mass from how easily current passes through body water. Check again at the same time of day, before eating, before reading anything into it.
Is fat free mass the same as muscle mass?
No. Fat free mass includes muscle but also bone, organs, blood, skin and the water inside all of them. MRI studies put skeletal muscle at roughly 45% to 50% of fat free mass. A high FFM can come from a large frame or extra water, so it is not a pure muscle score.
Is fat free mass the same as lean body mass?
For practical purposes, yes. Older sources say lean body mass includes a little essential fat, but a 2024 review in Advances in Nutrition found the two are chemically the same and recommended using the term fat free mass. Calculators and scales use the names interchangeably.
The Bottom Line
Fat free mass is your weight minus your fat, and it is a measurement you can do at home in two lines of arithmetic. The hard part is the body fat number, not the formula. Use the height table to see where an average person lands, use FFMI if you want a fair comparison across heights, and track one method over time instead of chasing single readings.
This article is for education and is not medical advice. Talk to a doctor or registered dietitian before changing your diet or training because of a body composition result.
References and Sources
- Heymsfield SB, Brown J, Ramirez S, Prado CM, Tinsley GM, Gonzalez MC. Are lean body mass and fat free mass the same or different body components? A critical perspective. Advances in Nutrition. 2024;15(12):100335. PMID 39510253. Source
- Schutz Y, Kyle UUG, Pichard C. Fat free mass index and fat mass index percentiles in Caucasians aged 18 to 98 years. International Journal of Obesity. 2002;26(7):953-960. PMID 12080449. Source
- Kyle UG, Genton L, Slosman DO, Pichard C. Fat free and fat mass percentiles in 5225 healthy subjects aged 15 to 98 years. Nutrition. 2001;17(7-8):534-541. PMID 11448570. Source
- Morton RW, Murphy KT, McKellar SR, et al. A systematic review, meta analysis and meta regression of the effect of protein supplementation on resistance training induced gains in muscle mass and strength in healthy adults. British Journal of Sports Medicine. 2018;52(6):376-384. PMID 28698222. Source
- Measurement Toolkit. Fat free mass (FFM) and fat mass (FM) normalized for size. Source
- Oliver CJ, et al. Fat free mass: friend or foe to metabolic health? 2025. Source
- Boer P. Estimated lean body mass as an index for normalization of body fluid volumes in humans. American Journal of Physiology. 1984;247(4 Pt 2):F632-F636. PMID 6496691. Source
- Hume R. Prediction of lean body mass from height and weight. Journal of Clinical Pathology. 1966;19(4):389-391. PMID 5929341. Source