Quick Summary
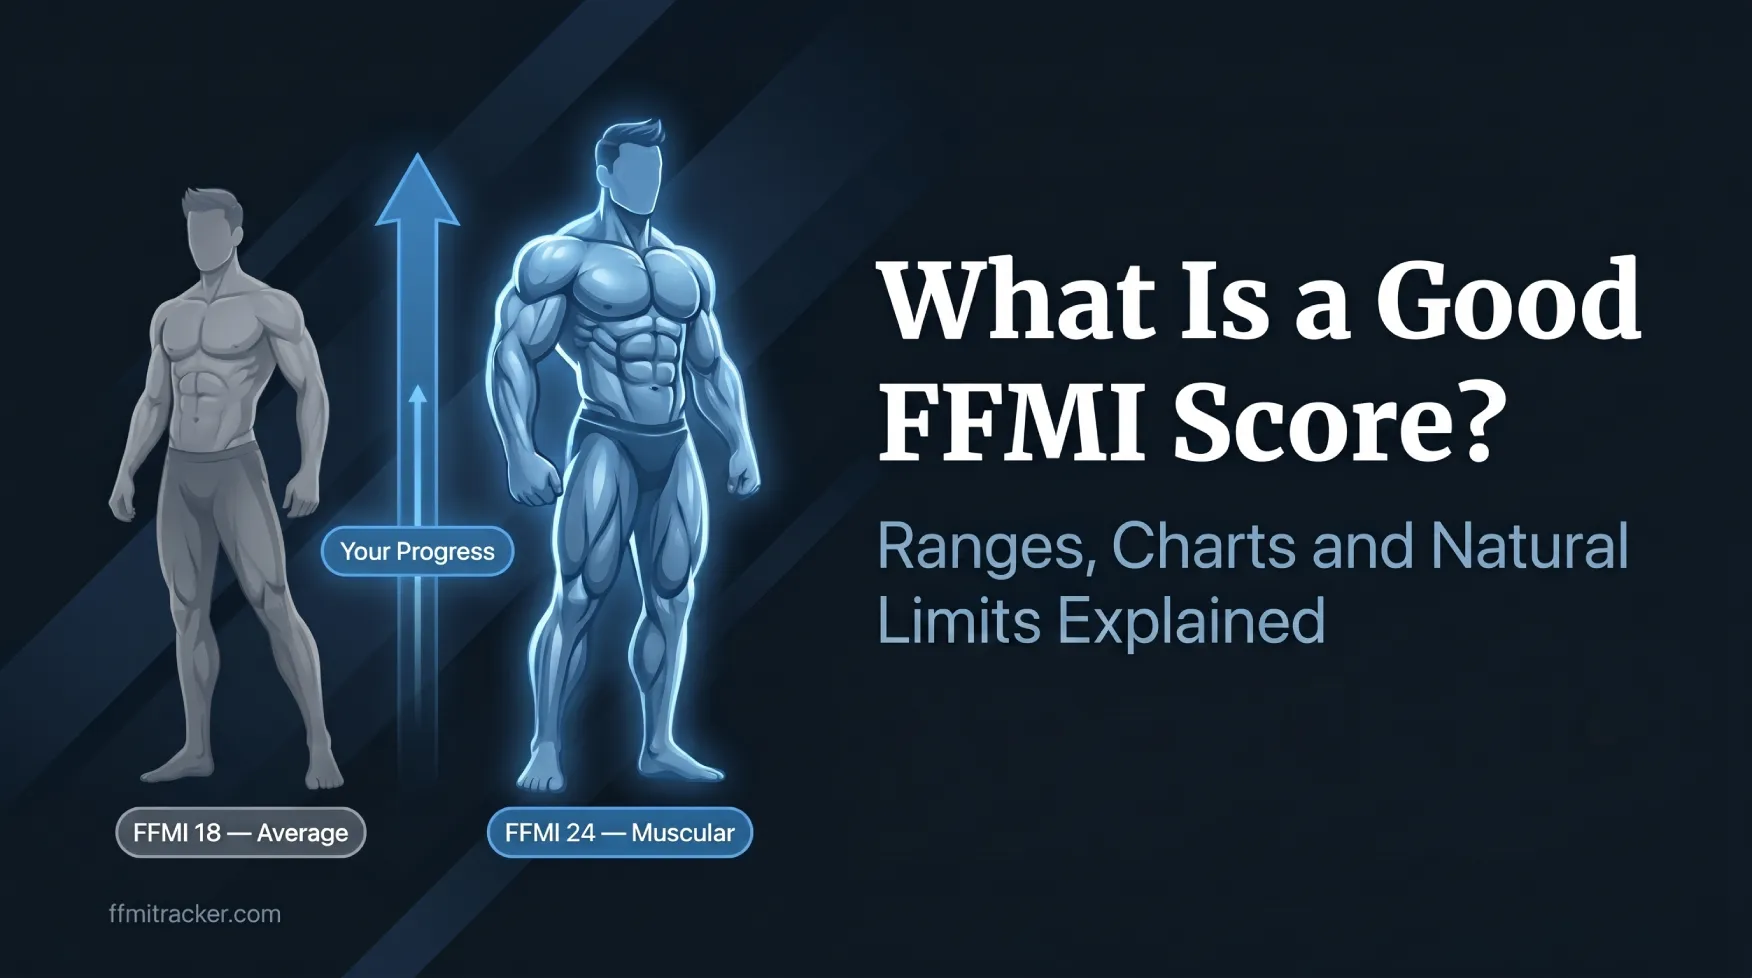
The Fat-Free Mass Index (FFMI) measures your lean muscle mass relative to your height by removing body fat from the calculation. A score of 18 to 20 is average for men and 15 to 17 for women. Athletic physiques typically fall between 20 to 22 for men and 17 to 19 for women. Most natural lifters peak below 25, which research identifies as the practical upper limit for drug-free muscle development.
Have you ever felt that your body weight looks normal, but you still do not look muscular or fit?
The reason is simple. Your total body weight does not tell you how much of it is muscle and how much is fat. Two people can have the same weight and height, but their body composition can be completely different.
That is where the Fat-Free Mass Index becomes useful. It helps you understand your lean body mass based on your height, weight, and body fat percentage. Unlike BMI, which only looks at total weight, it focuses on fat-free mass giving you a clearer picture of your actual muscle level.
In this guide, you will learn what the fat-free mass index is, how it is calculated step by step, what your score actually means, and how to use it to improve your fitness.
What Is FFMI?
FFMI stands for Fat-Free Mass Index. It is used to measure how much lean muscle your body has compared to your height.
In simple words, it tells you how muscular your body is without including body fat.
Instead of looking at your total body weight, it focuses on your fat-free mass. This includes muscle, bones, organs, body water, and other lean tissues.
By removing body fat from the calculation, the fat-free mass index gives a more accurate picture of your actual muscle level and overall body composition.
This concept is supported by a well-known 1995 study by Kouri et al., which analyzed body composition in over 150 male athletes to establish practical reference ranges for natural muscle development.
Source: Kouri EM et al. (1995). Fat-free mass index in users and nonusers of anabolic-androgenic steroids.
Why the Fat-Free Mass Index Is More Useful Than BMI
Many people rely on BMI to judge their fitness, but BMI only uses height and total weight. It cannot tell whether your weight is coming from muscle or fat.
The fat-free mass index solves this problem.
- BMI may show a muscular person as overweight
- The fat-free mass index shows how much of your weight is actual muscle
- It gives a clearer picture of body composition
That is why it is more useful for gym-goers, athletes, and anyone tracking muscle development.
Simple Real-Life Example
Imagine two people with the same height and weight.
Person A has 20% body fat and weighs 80 kg. Their lean mass is 64 kg.
Person B has 28% body fat and also weighs 80 kg. Their lean mass is only 57.6 kg.
BMI will show the same result for both.
But the FFMI will clearly show that Person A is more muscular.
This is why it gives a more practical and realistic view of fitness progress.
Why the Fat-Free Mass Index Is Important
Most people only look at their body weight and think they understand their fitness level. But in reality, weight alone does not tell the full story.
Your total body weight includes both fat and muscle. This means you can lose fat and gain muscle at the same time, but the number on the scale may not change much. That is where this tool becomes important. It focuses on lean body mass instead of just total weight.
It Helps You Track Real Muscle Progress
When you track your score, you are not just tracking weight. You are tracking how much of your body is actually muscle.
- It shows real muscle growth, not just weight change
- It helps separate fat gain from muscle gain
- It gives better insight into your actual body composition
For example, if your weight stays the same but your body fat decreases, your score will increase. This means you are gaining muscle even if the scale does not change.
It Helps You Set Realistic Goals
Many people set unrealistic fitness goals because they only focus on body weight. But muscle growth is a slow process, and not everyone can reach the same level.
The fat-free mass index helps you understand what is realistically achievable based on your body structure and natural limits. Research has shown that there is a natural upper limit for muscle development, often discussed using these ranges.
- Gives you a clear idea of your natural muscle potential
- Prevents unrealistic expectations
- Keeps your progress practical and measurable
It Makes Your Training More Purposeful
When you understand your score, your training becomes more focused instead of random. Instead of guessing, you can adjust your diet based on where your lean mass stands, improve your workout plan to target actual muscle development, and track long-term muscle progress in a meaningful way. This helps you build muscle in a more structured and consistent way.
FFMI vs BMI
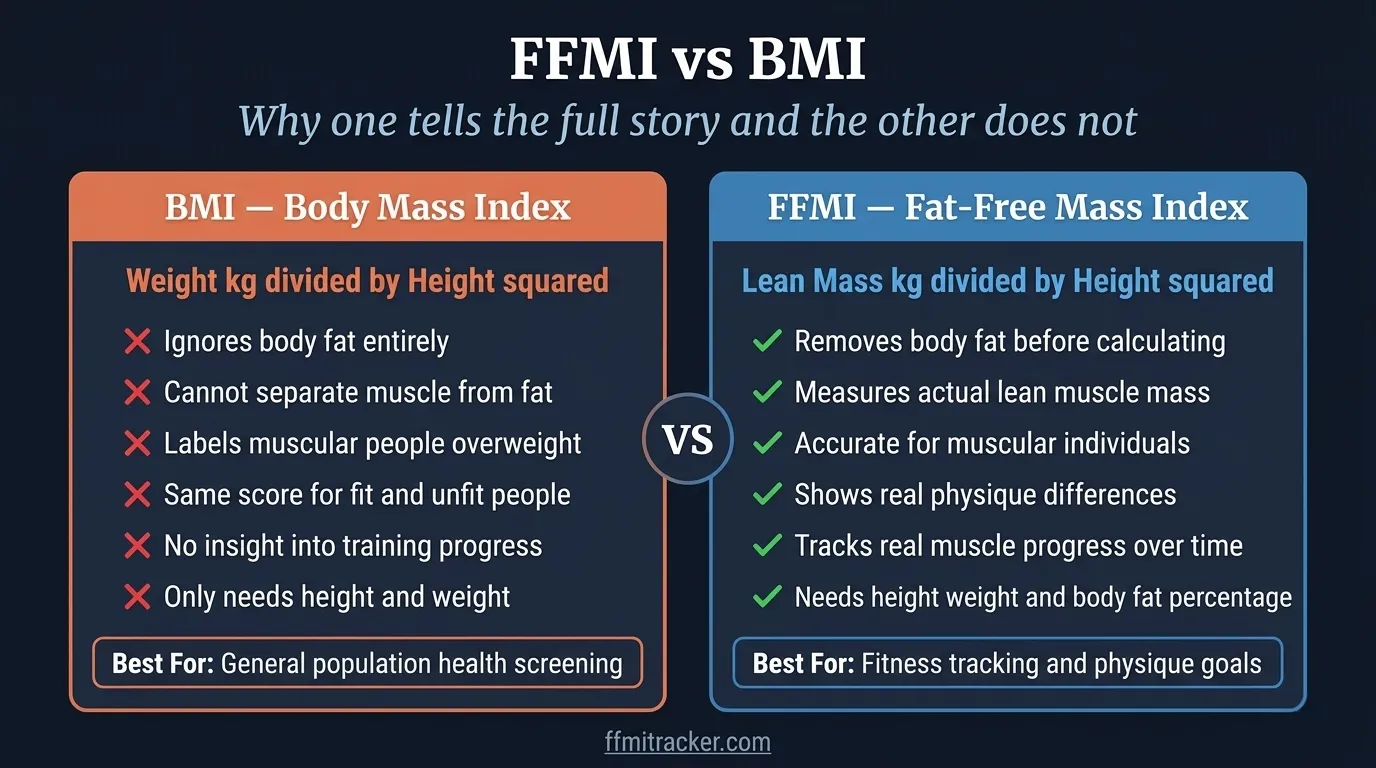
Many people confuse these two measurements, but they measure completely different things.
BMI only looks at your total body weight compared to your height. The fat-free mass index focuses on lean body mass by removing body fat from the calculation first. This makes it much more useful for understanding real muscle development.
Key Difference Between Both Measurements
Feature | BMI | Fat-Free Mass Index |
|---|---|---|
What it measures | Total body weight | Lean muscle mass only |
Considers body fat | ❌ No | ✔ Yes — removes it first |
Accuracy for fitness | Low | High |
Best for | General health screening | Muscle tracking and physique goals |
The Formula Explained (Step-by-Step)
The calculation may look complex at first, but when you break it into simple steps, it becomes easy to understand.
You do not need to calculate it manually because the calculator does everything for you. However, understanding the formula helps you know how your result is generated.
Step 1 – Calculate Your Lean Body Mass
Before anything else, you need to remove body fat from your total weight. This gives you your fat-free mass.
Step | Formula |
|---|---|
Total Body Fat | Body Weight × (Body Fat % ÷ 100) |
Lean Body Mass | Body Weight × (1 − Body Fat % ÷ 100) |
Step 2 – Calculate the Score
Once you have your lean body mass, divide it by the square of your height in meters.
Step | Formula |
|---|---|
Fat-Free Mass Index | Lean Body Mass (kg) ÷ Height² (m²) |
This final number is your score. It shows your muscle level relative to your height.
This method of calculating lean mass relative to height is widely used in fitness research to assess muscular development more accurately.
Step 3 – What Is Normalized FFMI?
Normalized FFMI is an adjusted version of the score that removes the height advantage or disadvantage.
In simple words, taller people naturally carry more lean mass, even if they are not more muscular. Because of this, their raw score can appear higher than shorter individuals.
To solve this, normalized FFMI adjusts the result to a standard height of 1.8 meters (5’11”). This height was used as the reference point in the original Kouri et al. research.
Step | Formula |
|---|---|
Normalized FFMI | FFMI + (6.3 × (1.8 − Height in meters)) |
.This makes it easier and fairer to compare muscle levels between people of different heights.
Real Example Calculations (Male and Female)
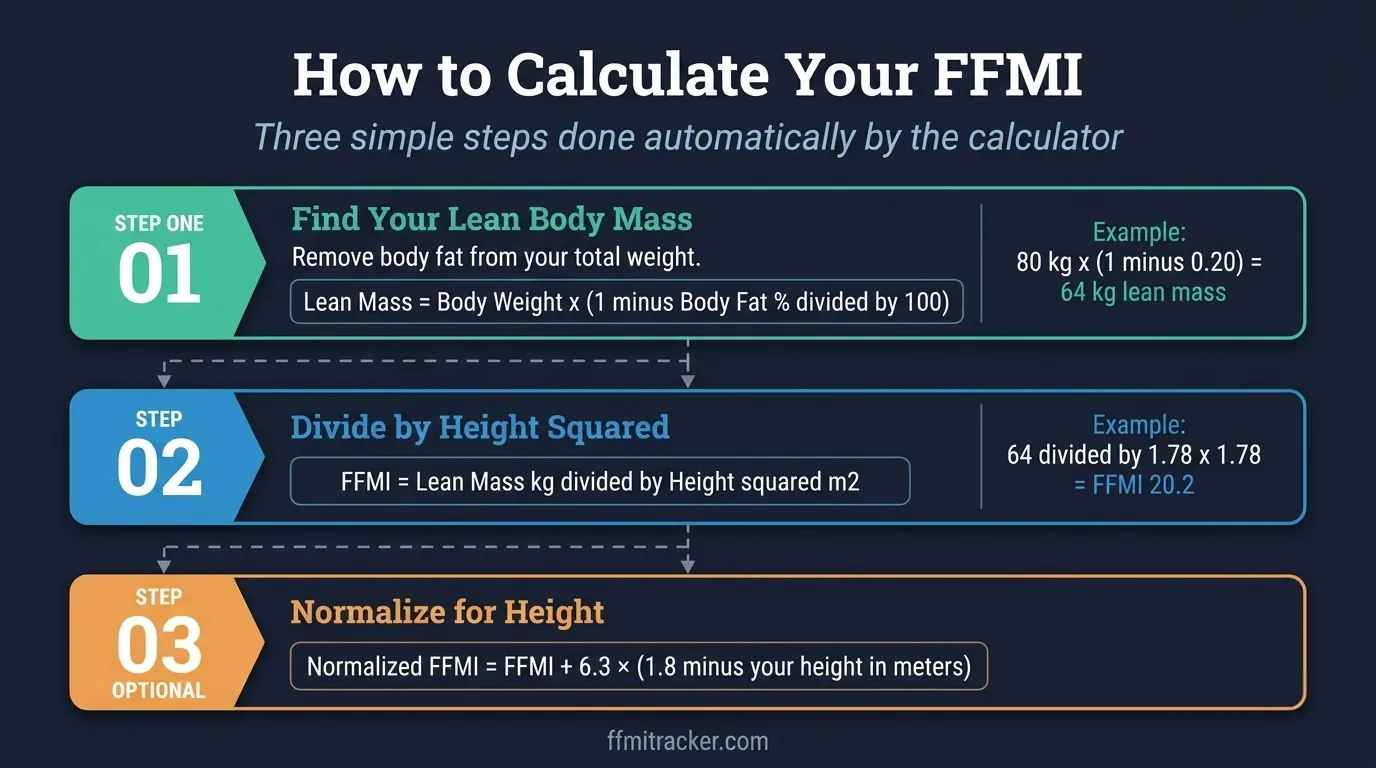
Understanding the formula becomes much easier when you see real examples. Below are two step-by-step calculations. The first is for a male and the second is for a female.
Example 1 – Male
Assume a person has:
- Weight = 78 kg
- Height = 1.80 m
- Body Fat = 16%
Now let’s calculate step by step.
Step 1: Lean Body Mass
Lean Body Mass = 78 × (1 − 0.16) = 78 × 0.84 = 65.5 kg
Step 2: Apply the Formula
FFMI = 65.5 ÷ (1.80 × 1.80) = 65.5 ÷ 3.24 ≈ 20.2
Step 3: Normalized FFMI
Normalized = 20.2 + (6.3 × (1.8 − 1.80)) = 20.2 + 0 = 20.2
A score of 20.2 places this person in the athletic range. This is consistent with someone who has been training seriously for 2 to 3 years.
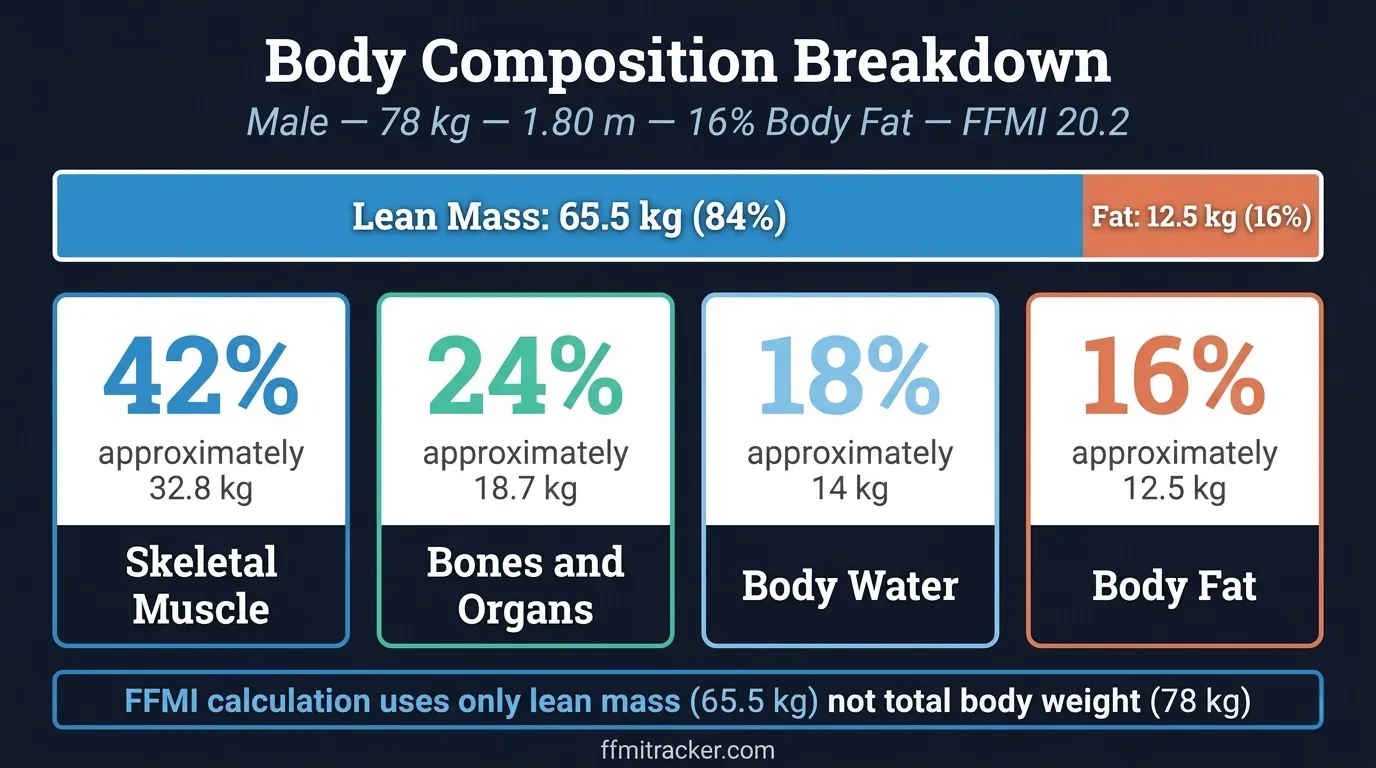
Example 2 – Female
Assume a person has:
- Weight = 62 kg
- Height = 1.65 m
- Body Fat = 22%
Now let’s calculate step by step.
Step 1: Lean Body Mass
Lean Body Mass = 62 × (1 − 0.22) = 62 × 0.78 = 48.4 kg
Step 2: Apply the Formula
FFMI = 48.4 ÷ (1.65 × 1.65) = 48.4 ÷ 2.72 ≈ 17.8
Step 3: Normalized FFMI
Normalized = 17.8 + (6.3 × (1.8 − 1.65)) = 17.8 + 0.95 ≈ 18.7
Because she is shorter than 1.80 m, her normalized score is slightly higher than her raw score. A result of 18.7 for a woman indicates an athletic physique. This is above average for the general female population.
You can also use our FFMI calculator to skip manual calculations and get your result instantly.
How to Measure Your Body Fat Percentage
Body fat percentage is the most important input in this formula. If this number is wrong, your final score will also be wrong.
The good news is that you do not need a perfect measurement. You just need a consistent one. Below are the most common methods you can use:
Method | Accuracy | Best For |
|---|---|---|
DEXA Scan | Very High (±1–2%) | Precise baseline; serious athletes |
Skinfold Calipers | High (±3–5%) | Regular tracking with the same tester |
BIA Scale (Body Fat Scale) | Moderate (±3–8%) | Tracking trends at home over time |
Navy Tape Test | Moderate (±3–5%) | A quick starting estimate |
Visual Estimation | Low (±5–10%) | Rough reference only — not reliable for scoring |
For tracking your fat-free mass index over time, the most important thing is to use the same method every time. This way, your results are consistent and meaningful even if they are not laboratory-perfect.
If you use a BIA scale, always measure under the same conditions. Use the same time of day, stay fasted, and keep the same hydration level. Water retention and recent meals can shift the reading significantly. |
What Is a Good Score?
After calculating your result, the next question is simple: is your score good or not?
The answer depends on your gender, training level, and body composition. It is not just a number. It helps you understand where you stand in terms of muscle development.
Score Ranges for Men
Score Range | Level | What It Generally Means |
|---|---|---|
Below 18 | Below Average | Limited training history or high body fat relative to muscle |
18 to 20 | Average | Normal healthy adult with some activity level |
20 to 22 | Athletic | Consistent training over 1 to 3 years with visible muscle development |
22 to 25 | Muscular | Serious lifters with several years of structured training |
25+ | Exceptional | Rare naturally — requires elite genetics and many years of optimized training |
Score Ranges for Women
Score Range | Level | What It Generally Means |
|---|---|---|
Below 15 | Below Average | Minimal muscle development or very early stage of training |
15 to 17 | Average | Normal healthy adult with light to moderate activity |
17 to 19 | Athletic | Regular training with visible muscle tone and lean composition |
19 to 21 | Muscular | Advanced female lifter with consistent, structured training |
21+ | Exceptional | Very rare naturally — requires elite genetics and long-term dedication |
Women’s ranges are lower than men’s because of natural biological differences in hormones and muscle fiber distribution. This does not mean women cannot build impressive physiques. It simply means the comparison is made within the right context.
These ranges are general guidelines and may vary based on genetics, training history, and body fat accuracy.
A Note on Age
Muscle mass naturally starts to decline after your mid-30s. This means a 45-year-old who maintains a score of 21 is actually doing very well compared to someone younger at the same number.
If you are over 40, it is better to track your own score over time rather than comparing it to charts built on younger populations. Keeping your score stable as you age is itself a meaningful achievement.
Natural Limit Explained
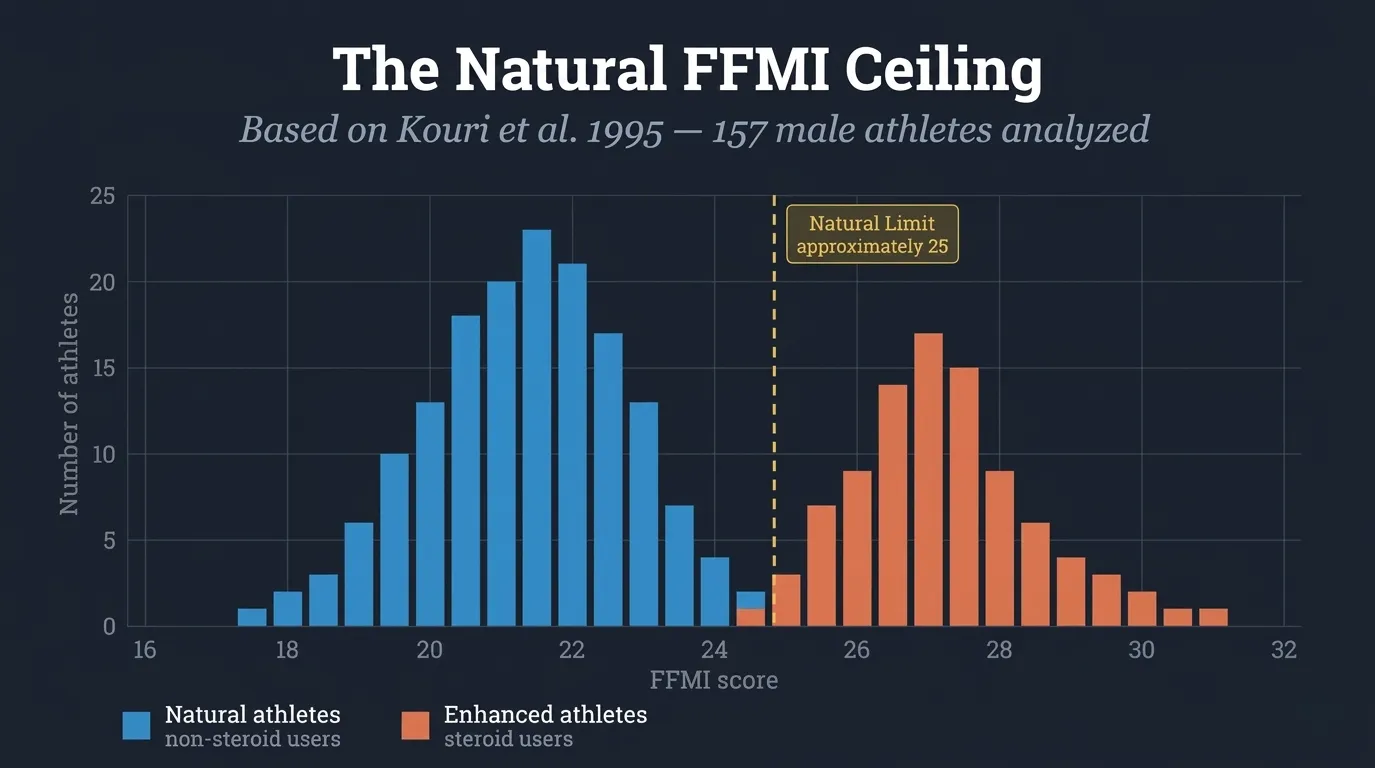
Many people want to know how much muscle they can build naturally. This is where the fat-free mass index becomes very useful because it gives a rough idea of natural muscular potential.
A well-known 1995 study by Kouri, Pope, Katz, and Oliva looked at over 150 male athletes — including natural lifters, steroid users, and collegiate athletes. The researchers found that natural athletes tended to cluster below a score of 25, while enhanced lifters showed values clearly above this range.
Among pre-steroid era athletes, most scores were found between 24 and 27, which suggests that reaching or slightly exceeding 25 naturally is possible with elite genetics but it is not common.
Why a Score Around 25 Is Considered High
The reason behind this number is based on real athlete data, not guesswork.
In research, natural athletes and pre-steroid era bodybuilders were found to have values close to this range. At the same time, steroid users showed significantly higher values. This is why 25 is often used as a practical upper reference for natural muscle development.
It is important to understand that 25 is not a hard wall. It is a statistical observation. Some people with exceptional genetics do reach or pass this number naturally.
Typical Score Ranges by Sport and Training Style
Different sports and training styles produce different results. Knowing where your activity typically lands helps you set expectations that make sense for your goals.
Sport or Training Style | Typical Male Range | Typical Female Range |
|---|---|---|
Endurance running or cycling | 18–20 | 15–17 |
Recreational gym-goer | 19–21 | 16–18 |
Natural bodybuilding | 21–24 | 17–20 |
Powerlifting | 21–25 | 17–21 |
CrossFit or functional fitness | 20–23 | 17–20 |
Pre-steroid era bodybuilders | 24–27 | — |
These ranges are general estimates. Individual variation is significant, and body fat measurement differences can affect where your score falls.
How to Improve Your Score
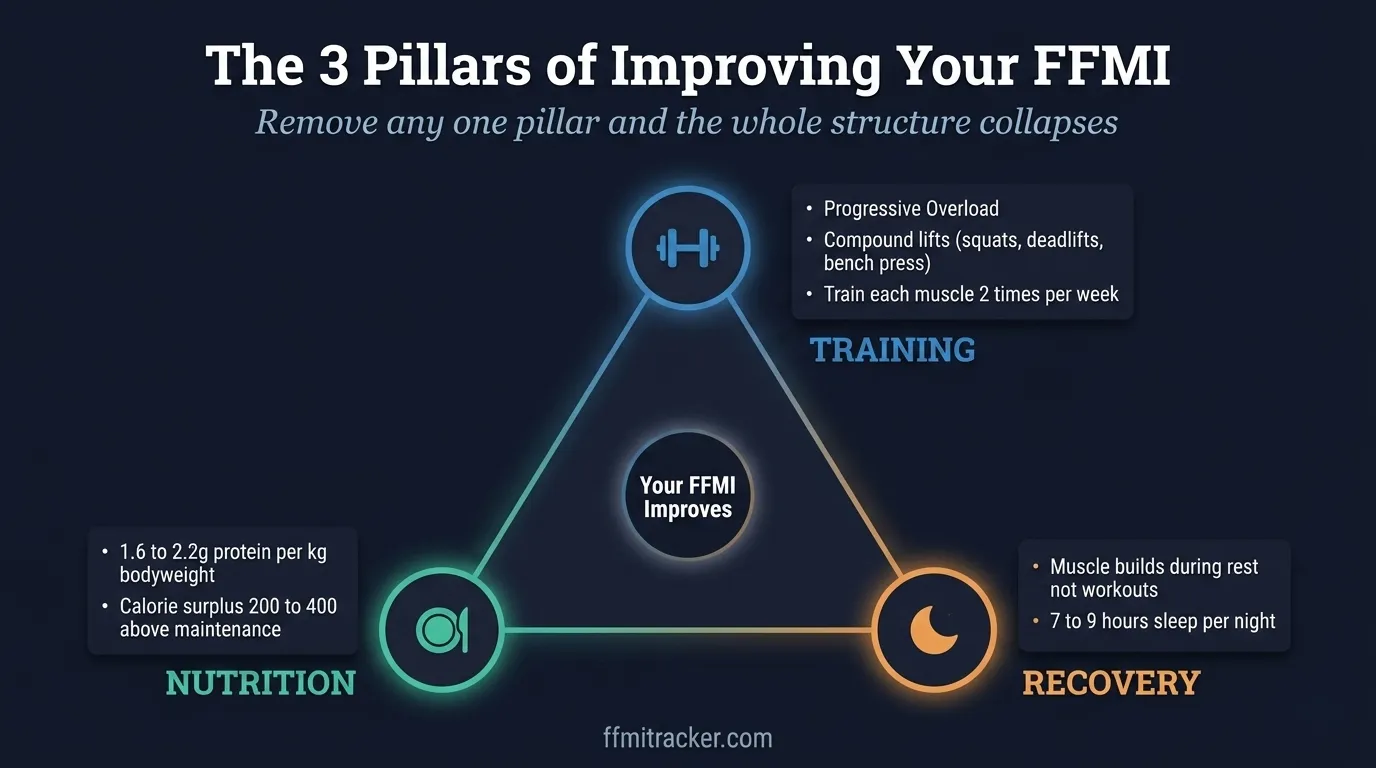
Improving your score is not about quick tricks. It is about building real muscle while managing body fat in a balanced and consistent way.
Since your height does not change, the only two variables you control are how much lean muscle you carry and how much fat you have. Your goal is simple: increase lean mass and control body fat.
Focus on Strength Training
Muscle growth only happens when your body is challenged regularly. This process is called hypertrophy and it requires a consistent, progressive stimulus.
- Follow compound exercises like squats, deadlifts, bench press, and overhead press. These recruit the most muscle at once
- Increase your weight or reps gradually over weeks and months. This is called progressive overload
- Train each muscle group at least twice per week for best results
- Allow enough rest and recovery. Muscle is built during rest, not during the workout itself
Improve Your Nutrition for Muscle Growth
Training alone is not enough. Your body needs proper nutrition to build lean muscle.
- Eat enough protein. Around 1.6 to 2.2 grams per kilogram of body weight per day supports muscle repair and growth
- Maintain a slight calorie surplus of 200 to 400 calories above maintenance for muscle gain
- Include balanced carbohydrates for energy and healthy fats for overall health
Research shows that protein intake and overall calorie balance play an important role in muscle development and recovery.
Common Mistakes When Using This Tool
Many people misunderstand how to use it correctly. Small mistakes can lead to wrong conclusions about your muscle level and progress.
Understanding these common errors can help you get more accurate and practical results.
Using an Incorrect Body Fat Percentage
Body fat percentage is the most important input in the formula. If this number is wrong, your final score will also be wrong.
Common mistakes include:
- Estimating body fat randomly or by looks alone. This can easily be off by 5 percentage points or more
- Using a BIA scale under inconsistent conditions. After eating, after exercise, or at different times of day
- Guessing instead of using a consistent measurement method
Even small errors in body fat can shift your score by 1 to 2 points. That is why it is better to use a consistent method every time instead of chasing perfect accuracy.
Treating It as a Competition Instead of a Personal Tool
Many people treat their score as a target to chase or a number to compare with others. This is not how it is meant to be used.
- Comparing your score with someone online introduces variables you cannot see. Their measurement method, their conditions, and their honesty
- Trying to reach a specific score quickly often leads to poor decisions like extreme dieting or overtraining
- Ignoring your actual fitness progress in favor of chasing a number
The fat-free mass index should be used to track your own improvement over time. It should not be used to compete with unrealistic standards.
Checking It Too Often
Lean mass changes slowly. Calculating your score every week introduces noise. Small fluctuations from water retention and measurement variability can make it look like your body is changing when it is not.
Reassessing every 8 to 12 weeks gives enough time for real changes to appear. Small improvements over months show true muscle progress.
Limitations of This Measurement
The fat-free mass index is a helpful tool, but it is not perfect. It should be used as a guide, not as a final judgment of your fitness or health.
- It depends entirely on your body fat accuracy. If your body fat input is wrong, so is your result
- It does not measure strength, endurance, or overall health. A person can have a high score but still lack cardiovascular fitness or mobility
- It was originally developed and tested mostly on male subjects. The female ranges are less rigorously researched
- It does not adjust for bone density differences. Athletes with denser bones may score higher without having more actual muscle
- Genetics play a role. Some people naturally carry more lean mass at the same training level as others
Because of these reasons, your score should be used to track your personal progress over time. It should not be used to judge yourself based on one single number.
Frequently Asked Questions
1. What is a good score for a natural lifter?
For most men, a score between 20 and 22 shows a solid athletic physique. For women, the equivalent range is 17 to 19. Most dedicated natural lifters plateau somewhere in these ranges after a few years of consistent training.
2. Is an FFMI of 25 achievable naturally?
It is possible but not common. Research by Kouri et al. (1995) found that most natural athletes fall below 25. Use it as a realistic upper reference, not a typical expectation.
3. What does a score of 22 mean?
For a man, 22 means above-average muscle development that takes several years of serious training to reach. For a woman, 22 is in the exceptional range. Either way, it reflects real and consistent effort.
4. Is 22 achievable naturally for men?
Yes, comfortably. A score of 22 is well within the natural range and is commonly reached after 3 to 5 years of structured training and proper nutrition. No enhancement is needed to get there.
5. Can women use this formula?
Yes, the formula is exactly the same for women. Only the interpretation ranges are different because women naturally carry less lean mass. Always use the female reference ranges when reading your result.
6. How accurate is the score if I use a body fat scale?
Body fat scales have an error range of 3 to 8 percentage points, which can shift your score by 1 to 2 points. They are useful for tracking trends over time but not for precise single readings.
7. How often should I check my score?
Every 8 to 12 weeks is enough. Lean mass changes slowly, so checking more often just creates noise. Use the same measurement method each time to keep your results consistent.
Conclusion
The fat-free mass index is a simple and practical way to understand your lean muscle level instead of relying only on body weight. It gives you a clearer picture of your body composition and helps you track real muscle progress over time.
Most people who calculate their score for the first time find themselves in the 18 to 21 range. That is not a failure. It is your starting point. It tells you exactly how much room you have to grow and helps you set a direction for your training and nutrition.
Instead of focusing on a single number, use it as a guide. Check it every few months, keep your body fat measurement consistent, and watch what steady training actually produces over time.
If you want to check your own result right now, you can use our calculator tool to get an instant and easy estimate.